Data, Diarrhea, and Dinner: How Numbers Can Save Your Stomach
Okay, so data analysis is basically this thing where you take a bunch of numbers, throw them into a blender (metaphorically, unless you’re into that), and out comes… predictions. Fancy, right? Now, apply this sorcery to foodborne illnesses, and suddenly you’ve got a crystal ball that tells you whether that burger you’re eyeing is a delicious treat or a one-way ticket to the bathroom.

So, grab a (statistically safe) snack and let’s dive into how numbers can save your stomach. Because honestly, who doesn’t want to know if their salad is plotting against them?
Section 1: Spoilage and Shelf Life
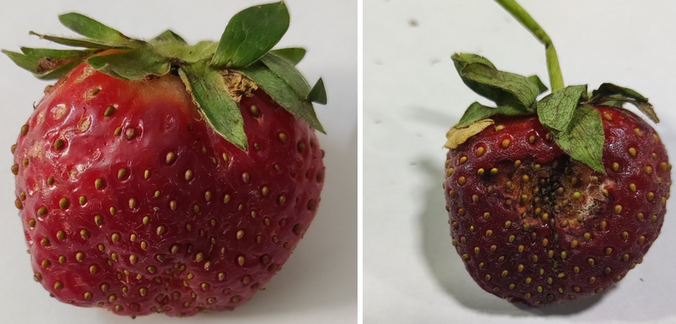
Spoiled food is basically a bacteria rave—Salmonella, E. coli, and Listeria are the uninvited guests, and nausea, vomiting, and diarrhea are the party favors. These little troublemakers love warm, moist environments, like a person’s axilla in the Peepee island.
Enter AI (with the Imperial March playing in the background). By analyzing high-res images of fruits and veggies, computer vision can spot mold, discoloration, and other signs of spoilage faster than you can procastinate. For example, Convolutional Neural Networks (CNNs) can be trained to tell the difference between fresh and rotten produce.
Section 2: Water Quality
Water quality isn’t just about clarity—it’s a chemical battleground where pH, hardness, and dissolved solids determine whether pathogens like E. coli or Vibrio cholerae thrive or die. The table breaks it all down, showing how these factors impact food safety and what levels keep your water (and your food) safe.
| Parameter | Low Level | High Level | Optimal Value |
|---|---|---|---|
| pH | Growth of certain acid-tolerant pathogens (e.g., Vibrio cholerae). | Growth of some pathogens, such as E. coli and Salmonella. | 6.5 to 8.5 |
| Hardness | Increases the risk of opportunistic pathogens like Legionella and Pseudomonas. | Increases the risk of biofilm-associated pathogens. | 60–120 mg/L |
| Solids | Allows resilient parasites like Giardia and Cryptosporidium. | Supports the growth of bacterial pathogens such as E. coli, Salmonella, Vibrio cholerae, and Legionella pneumophila. | ≤ 500 ppm |
| Chloramines | Increase the risk of bacterial survival. | Lower the risk of microbial contamination by effectively killing pathogens. | 1–4 ppm |
| Sulfate | Not directly linked to foodborne illness or pathogen growth. | Contribute to biofilm formation in pipes, potentially harboring pathogens like Legionella. | ≤ 250 mg/L |
| Conductivity | Less hospitable to microbial life. | Supports the growth of bacterial pathogens like E. coli, Salmonella, and Campylobacter. | 200–800 μS/cm |
| Organic Carbon | Less likely to support pathogen growth. | Promotes the growth of foodborne pathogens like E. coli, Salmonella, and Campylobacter. | ≤ 2 ppm |
| Trihalomethane | Reducing the risk of foodborne illness by killing pathogens like E. coli, Salmonella, and Campylobacter. | Associated with poorer water treatment practices, increasing the potential for pathogen survival and contamination. | ≤ 80 μg/L |
| Turbidity | Indicating good water quality and effective filtration. | Increases the risk of foodborne illness by protecting pathogens from disinfectants. | ≤ 1 NTU |
| Potability | Potability = 0 indicates that the water is not safe for human consumption. | Potability = 1 indicates that the water is safe and free from pathogens. | 1 (Potable) |
Section 3: Socio-Economic Factors
Foodborne illnesses don’t exist in a vacuum—they’re shaped by the world around us. From lax food safety regulations in developing countries to gaps in health infrastructure, literacy rates, and income levels, these socio-economic factors create the perfect storm for pathogens to thrive.
- Food Safety Regulation: Outdated farming practices, poor storage, and weak regulations amplify contamination risks.
- Health Infrastructure: Strong systems are key to detecting outbreaks and enforcing safety measures.
- Literacy Rates: Knowledge is power—health literacy reduces foodborne risks by empowering better food handling.
- Income Levels: Low-income regions bear the brunt of foodborne diseases, with informal markets and weak monitoring exacerbating the problem.
1 DALY = 1 year of healthy life lost.

Section 4: Hygiene
Improving hygiene practices—specifically in the context of food safety, not Reddit mods’ questionable shower habits—means tackling food storage and surface cleanliness in homes, restaurants, and factories.
-
Food Storage: Bacterial growth thrives on six arbitrary factors that I came up with: Food, Acidity, Time, Temperature, Oxygen, Moisture (FAT-TOM—no, Tom, this isn’t about you). Control these, and you control contamination. Or, you know, just let the bacteria throw a rave in your fridge. Real-time AI monitoring can track temperature, acidity, and moisture, flagging risks like spoilage or unsafe storage.

-
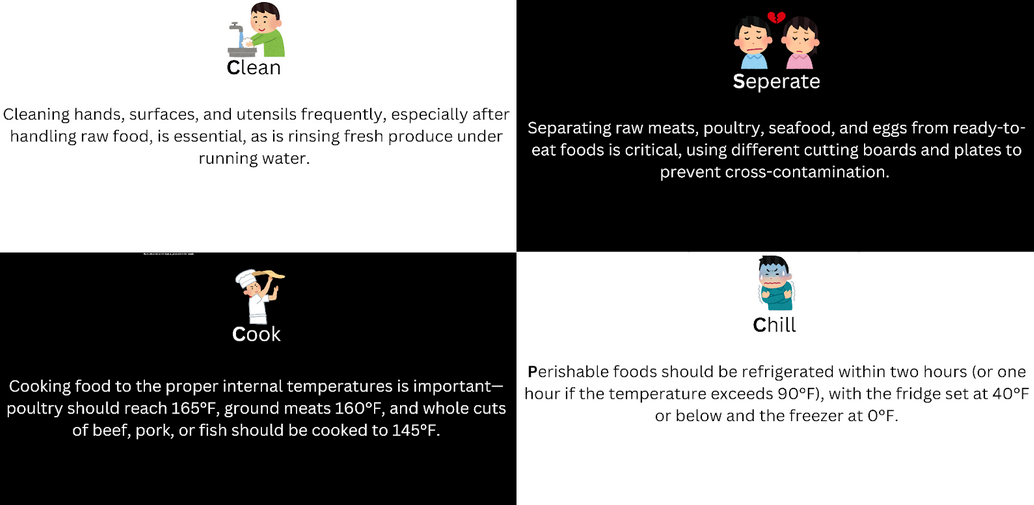
Surface Cleanliness: The CDC’s golden rules: Clean surfaces, separate raw and cooked foods, cook thoroughly, and chill promptly. Or, as I like to call it, “Basic fukeen practices.” AI models (e.g., regression, decision trees) can predict bacterial growth rates, offering tailored advice like, “If temp > X, bacteria go brrr.” Because nothing says “progress” like outsourcing your common sense to a machine.
Section 5: Preparation Context
Food preparation isn’t just about making things taste good—it’s about not poisoning your guests. Proper handling, hygiene, and avoiding cross-contamination are key. For example, fancy tech like Polymerase Chain Reaction (PCR) can detect contaminants, but let’s be real: washing your hands is cheaper. Dietary choices—veggie vs. meat, organic vs. conventional—also play a role in food safety risks.
Food Type: Veg/Non-Veg
- Vegetarian: Plants are less likely to host pathogens, but don’t get cocky—improper handling can still turn your salad into a biohazard.
- Non-Vegetarian: Meat, fish, and poultry are basically pathogen playgrounds. Undercooked chicken? Congrats, you’ve just hosted a Salmonella party.
Organic/Inorganic
- Organic: Fewer pesticides, but don’t let the “natural” label fool you—improper storage can still make your carrot a bacterial buffet.
- Conventional: More chemicals, but proper washing and cooking can make it just as safe. Either way, don’t skip the soap.
Preparation Styles
- Home Cooking: Lower risk if you’re not a slob.
- Street Food/Commercial: Higher risk, because who knows what’s happening behind that food cart?
Section 6: Climate
Just going to leave this here…
Analyze why I left this here and how it ties into data analysis—that’s your homework. Also, I think these blogs probably need a conclusion……………………………………. ……………………………………… ……………………………………… ……………………………………… ………………………… figure it out yourself; I’m not here to spoon-feed you!
(No, I didn’t drop it because I’m tired and craving that unhygienic, sweat-palmed, floor-prepared, yet inexplicably delicious street food. Definitely not.)
| Pathogen | Global Warming | Precipitation | Droughts | Ocean Changes | Storm | Floods |
|---|---|---|---|---|---|---|
| Campylobacter | High | Low | NA | NA | NA | NA |
| Staphylococci | Moderate | NA | NA | NA | NA | NA |
| Clostridium | Moderate | NA | NA | NA | NA | NA |
| Norovirus | Moderate | NA | NA | NA | NA | NA |
| E. coli | Moderate | Low | NA | NA | NA | NA |
| Salmonella | High | Moderate | Low | Low | Low | Low |
| Foodborne Parasites | High | High | Moderate | Low | Low | Moderate |
| Hepatitis A Virus | Moderate | Low | Low | Low | Low | Low |
| Unspecific | NA | NA | NA | NA | NA | Low |
- High: A strong and well-documented connection between the climatic factor and pathogen growth.
- Moderate: A notable connection with moderate evidence in research.
- Low: A weak or minimal connection.
- NA: No available data or connection identified in the reviewed studies